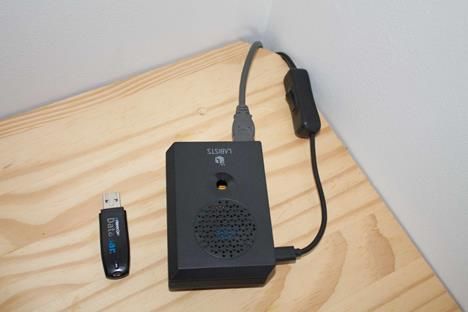
I have been recording meteors by radio scatter using a simple Yagi antenna and a low-cost software defined radio (SDR) connected to a laptop. The ionisation trails of meteors reflect radio waves. I wanted to see if a Raspberry PI could be used to replace the laptop. This has worked and the set up is described below. This is now possible because the latest Raspberry PI (4) is powerful enough to run the SDR application software. I use Echoes software which will run on the latest Raspberry PI. The photo below shows how compact the Raspberry PI computer is by comparing the PI with a USB flash drive. The PI consumes 3Amps at 5Volts provided by a special adapter. The PI costs about £50 depending on the accessories you purchase.
RADIO ASTRONOMY
Click image for slideshow
Radio Astronomy
Welcome to our new section on Radio Astronomy.
Several of our members have an interest in observing and recording solar and meteor activity using radio detection.
To start the ball rolling, last month Phil Rourke sent a few images of meteors detected with simple equipment, which are in a gallery at the bottom of this page. Now Phil has written an interesting article on new equipment with pictures on detecting using a Rapberry pi.
"Recording Meteor Radio Scatter With The Raspberry Pi Computer"
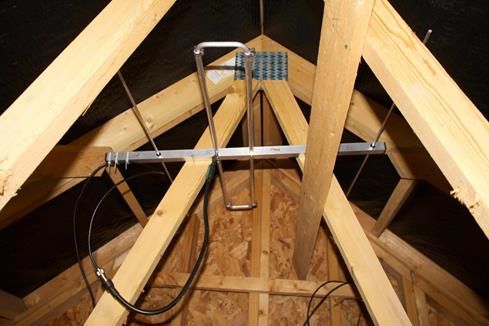
Above: The YAGI antenna supplied by InnovAntenna Ltd at a cost of £79. You can make your own antenna with DIY materials like hardwood, plumbing pipes and various electrical cables for about £40 however the InnovAntenna is superior to any DIY effort. It has features which improve interference rejection and the ability to receive weak signals. The antenna is in the loft 25 feet above ground. However, it is better to have the antenna mounted outside at the same height or higher.
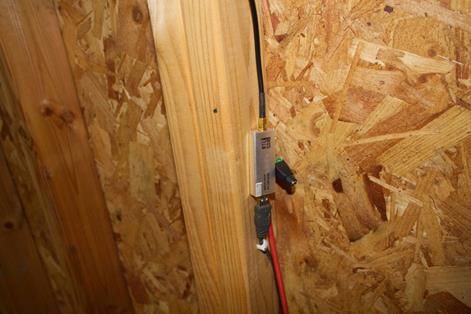
Here is the SDR radio which is a small compact device which must be controlled by a computer. The brand is RTL- SDR V3 blog and costs £30.
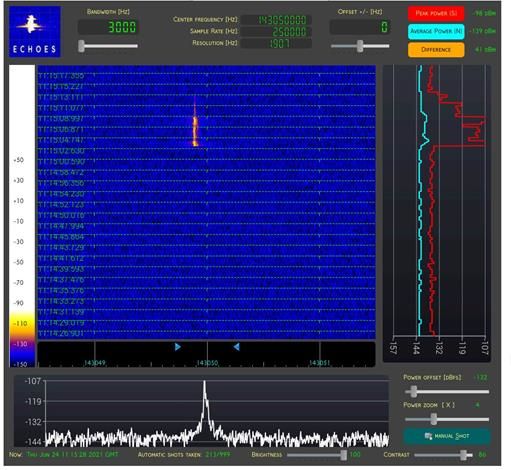
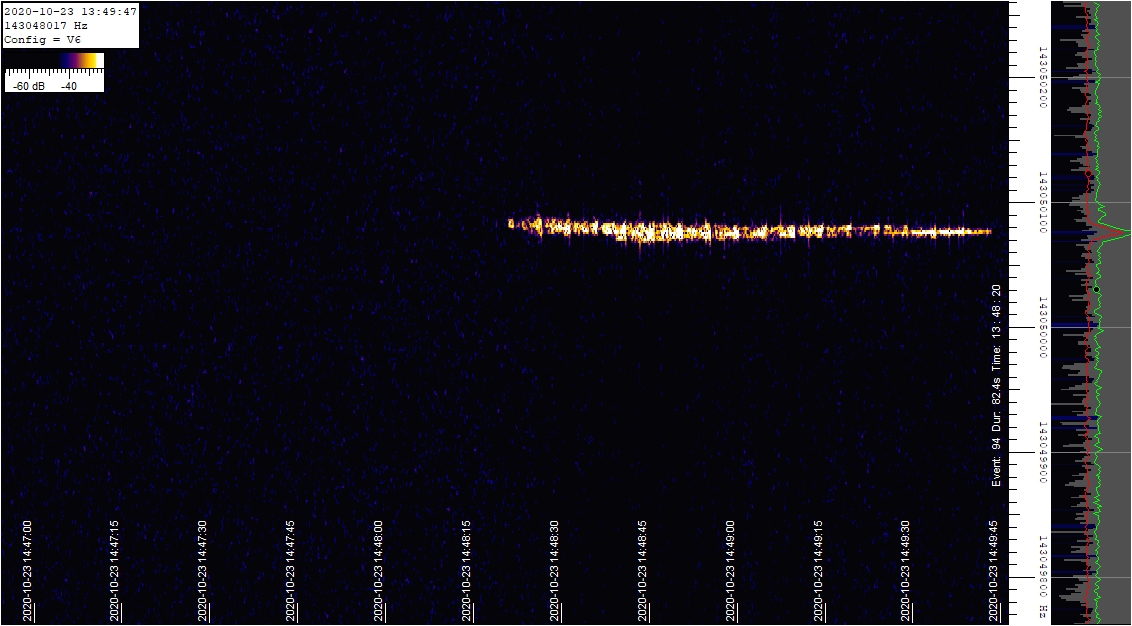
This is connected to the Raspberry PI via a 4-metre length USB cable. A screenshot of the Echoes software capturing a meteor radio scatter event is shown right.
The white trace shows the signal spike above the background noise and the main blue screen shows the duration of the meteor signal and the variation in signal strength over time by colour coding.
The photo above shows how compact the Raspberry PI computer is by comparing the PI with a USB flash drive. The PI consumes 3Amps at 5Volts provided by a special adapter. The PI costs about £50 depending on the accessories you purchase.
Having collected data in June using the Raspberry PI and the InnovAntenna it can be processed in Excel and Colourgram to give various insights. The Echoes software running on the PI collects screen shots for every radio scatter event and also records event data on the Libre Office spreadsheet. This Libre Office spreadsheet data can be imported into Excel. Libre Office is compatible with Microsoft Office. Below are Excel graphs showing the June activity.
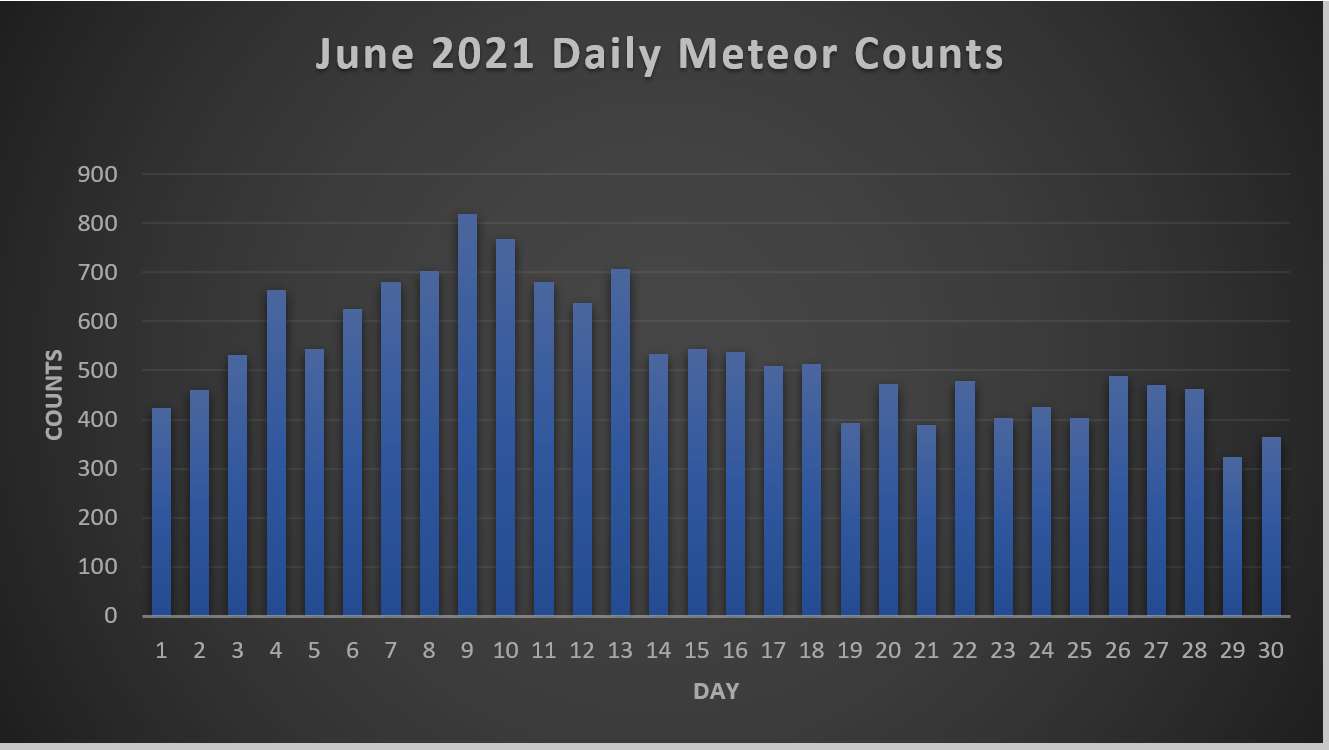
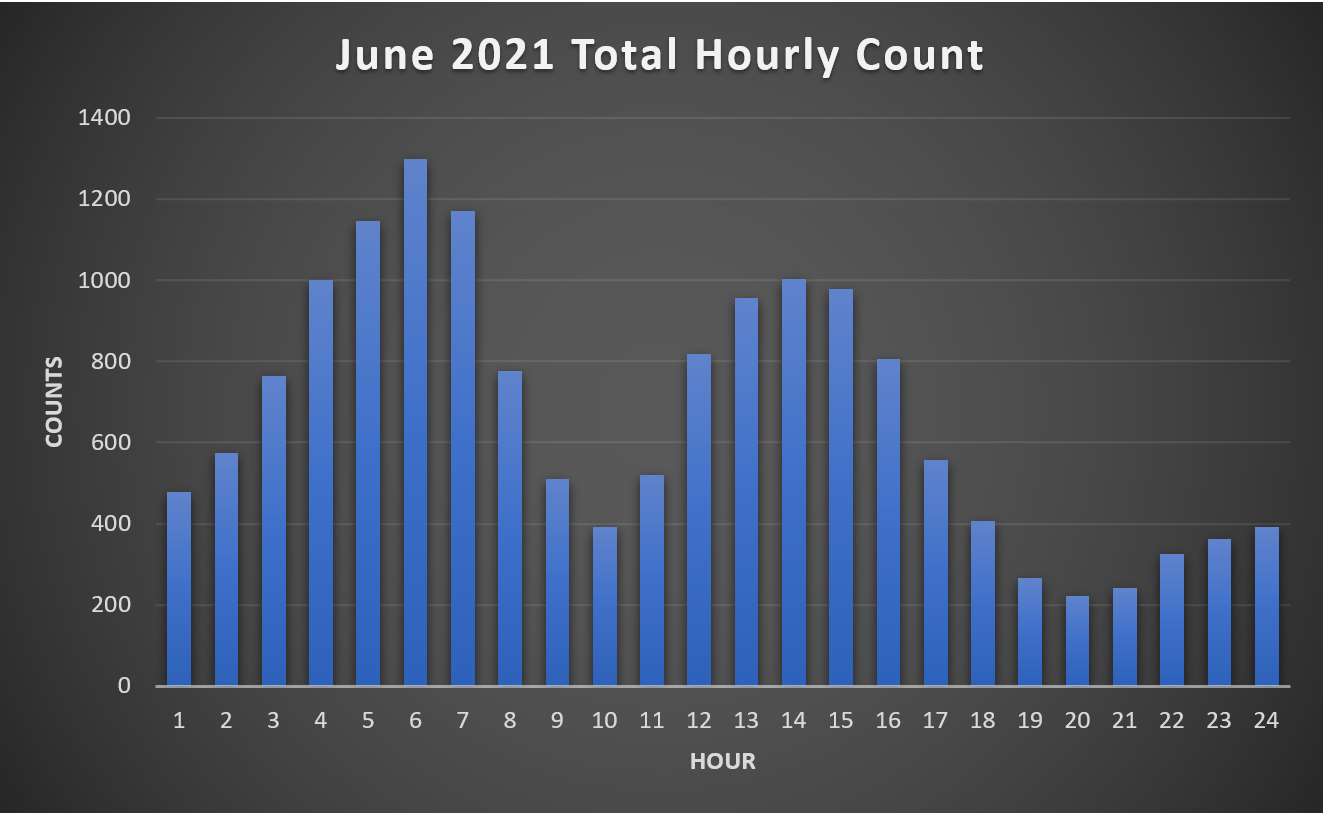
The variation in activity is largely due to sporadic meteors as the minor showers occurring in June are insignificant in terms of counts compared to the sporadic background.
The total hourly count across the month is useful to show daily meteor activity. The peak around dawn is due to the Earth now being face on to the meteor streams maximising the meteors collected. Furthermore, this is a head on collision so the Earth orbital speed is added to the meteor stream speed. At sunset the Earth orbital speed is subtracted from the trailing meteor stream speed so the entry speed is much reduced which accounts for a minimum activity around sunset. What accounts for the afternoon secondary peak? Answers on a postcard or email.
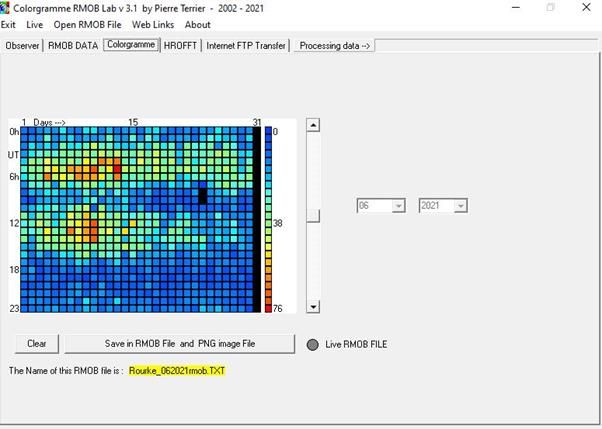
The monthly activity is shown on Colourgram software below which is a heat map of the monthly activity by day and by hour. Activity should always be viewed on individual screenshots to remove any interference. Interfering signals should be removed from the statistics. It is possible to view screenshots as a slide show with a short one second interval, so a day of counts say 600 can be reviewed in ten minutes. This is important if the counts are going to be sent for scientific analysis.
Take a look on the RMOB website for a view of the world- wide radio observers contributing to the website. This site also has links to various software used for radio meteor observing and some basic theory about how meteor radio scatter works.
A few images from Phil below